ruby-prof
公式サイト:
使い方
参考:
Ruby の ruby-prof を使って Octopress の generate でどれ位時間がかかってるか測ってみる | rcmdnk’s blog
How to Profile Tour Rails and Ruby Applications with ruby-prof | Aktagon Ltd.
Profiling Ruby with ruby-prof | HouseTrip Deck
Quick and Dirty Rails Performance Profiling | Hiltmon
Ruby on Rails アプリケーションのプロファイリング
参考:
Rack アプリケーションのプロファイリングを手軽に取りたい – Qiita
Rails アプリを ruby-prof と qcachegrind でプロファイリング | あろえの備忘録
Rails アプリケーションをプロファイリングしよう | TechRacho
Rake タスクをプロファイリングする
参考:
Add Profiling to Your Rake Tasks (hopsoft) – GitHub Gist
Ruby Rrofiling Rake Task (soulcutter) – GitHub Gist
Rails の Rake タスクをプロファイリング、特に使用メモリを知りたい – スタック・オーバーフロー
How to profile Rake task? – Stack Overflow
リポジトリ
ruby-prof/ruby-prof: a Profiler for MRI Ruby – GitHub
ruby-prof-flamegraph
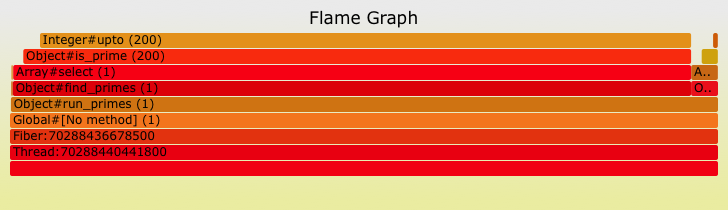
リポジトリ:
FlameGraph
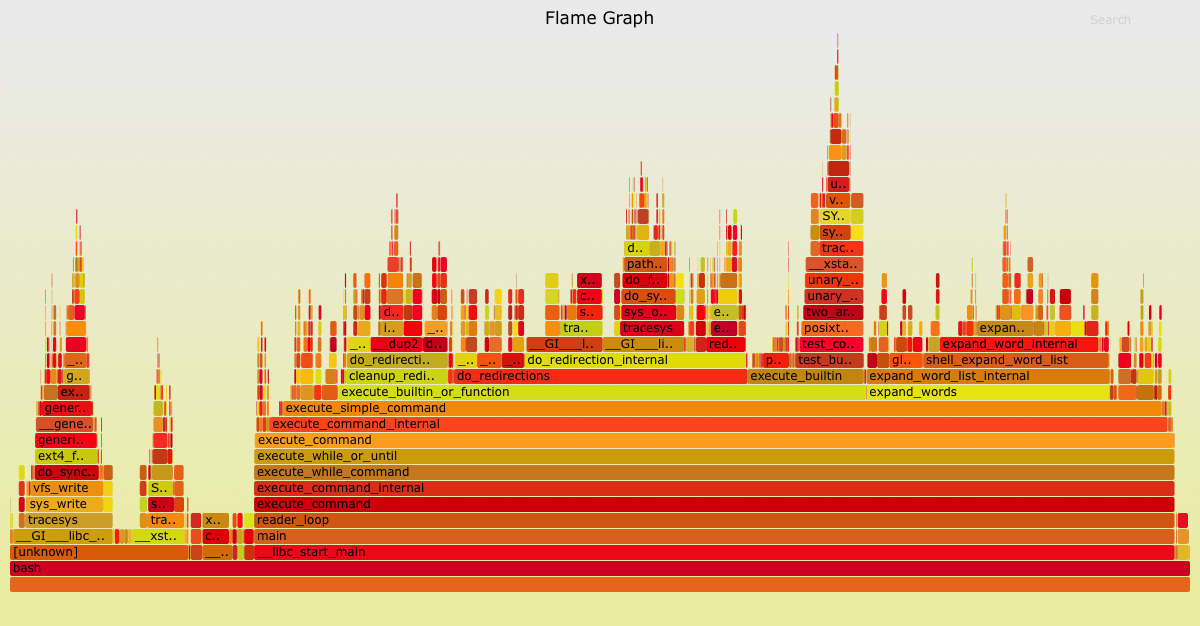
リポジトリ:
brendangregg/FlameGraph: Stack trace visualizer – GitHub
KCachegrind
公式サイト:
入手:
Download – KCachegrind Profiler Frontend | SourceForge.net
参考: