チュートリアル

Monitor Components
機能
- 任意の変数の値をグラフ化して表示
- Monitor Transform
- Monitor Rigidbody
- Monitor Rigidbody2D
コンポーネント
- Monitor AudioSource
- Monitor Component
- Monitor Rigidbody
- Monitor Rigidbody2D
- Monitor Transform
- Monitor Debug.Log
API
- Monitor クラス
- MonitorInput クラス
使い方
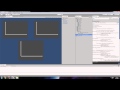
メニューから「Window > Monitors」を選択して、「Monitors」ウィンドウを開く。
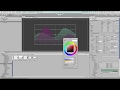
動画:


入手:
Monitor Components | Unity Asset Store [Official]
参考:
Monitor Components – パラメータやデバッグログを時系列グラフで閲覧できる | コガネブログ
Grapher
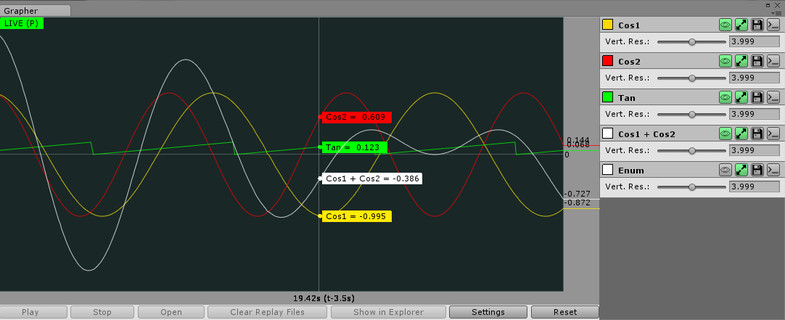
機能
- 変数の値をファイルに記録
- グラフ化
- リプレイ
- 型のサポート:float / int / bool / enum / List / Array / Queue / Vecto2 / Vector3
- ソースコードアクセス
入手:
Grapher – Graph / Replay / Log | Unity Asset Store [Official]
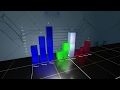
Physics Debugger + Graphs
機能
- 位置/速度/加速度をグラフ化
- 衝突法線の描画:撃力の大きさに比例した長さで表示する
- オブジェクトの移動軌跡を描画
- 予測軌道を描画
- ソースコードアクセス
入手:
Physics Debugger + Graphs | Unity Asset Store [Official]
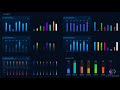
UCharts
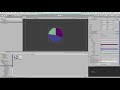
動画:
入手:
UCharts | Unity Asset Store [Official]
FPS Graph
動画:
 FPS Graph – Performance Analyzer for Unity3D
入手:
FPS Graph – Performance Analyzer | Unity Asset Store [Official]
フォーラム:
FPS Graph – Performance Analyzer Tool | Unity Forum
Stupid Simple Graphs 2D
動画:
入手:
Stupid Simple Graphs 2D | Unity Asset Store [Official]
Awesome Charts and Graphs
動画:
公式サイト:
Awesome Charts | Happy Pixels [Official]
入手:
Awesome Charts and Graphs | Unity Asset Store [Official]
ドキュメント:
Documentation – Awesome Charts (PDF) | Happy Pixels [Official]
フォーラム:
Debug Graphs
機能
- 凡例
- 色のカスタマイズ
- 点及び線表示の切り替え
- CSV ファイルへの出力
動画:
入手:
Debug Graphs | Unity Asset Store [Official]
フォーラム:
Debug Graphs – Debugging Assistant for Plotting and Data Visualization | Unity Forum
Simple Profiler
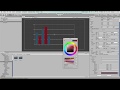
動画:
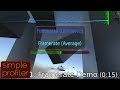
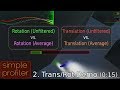 #2 Translation / Rotation Demo
入手:
Simple Profiler – Data Visualization Tool | Unity Asset Store [Official]
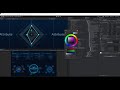
EzChart
グラフの種類
- 円グラフ
- 棒グラフ
- 折れ線グラフ
- ローズダイアグラム
- レーダーチャート
- ゲージ
機能
- 凡例
- 複数のデータ系統
- 負の値
- ランタイム描画
- 高パフォーマンス
- ツールチップ
- TextMesh Pro サポート
- ソースコードアクセス
動画:
入手:
EzChart | Unity Asset Store [Official]
デモ:
Demo – EzChart | Ice Pond Studio [Official]
Squiggle
動画:
入手:
Squiggle | Unity Asset Store [Official]
Graph Maker
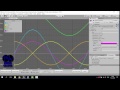
動画:
入手:
Graph Maker | Unity Asset Store [Official]
ドキュメント:
Manual – Graph Maker (PDF) | Stuart Summerfield
API – Graph Maker | Stuart Summerfield
デモ:
Demo 1 – Graph Maker | Stuart Summerfield
Demo 2 – Graph Maker | Stuart Summerfield
フォーラム:
Multiple Graph and Chart UI Pack
動画:

入手:
Multiple Graph and Chart UI Pack | Unity Asset Store [Official]
Graph and Chart
動画:
入手:
Graph And Chart | Unity Asset Store [Official]
フォーラム:
XCharts
リポジトリ:
monitor1394/unity-ugui-XCharts: A Charting and Data Visualization Library for Unity – GitHub